
Introduction
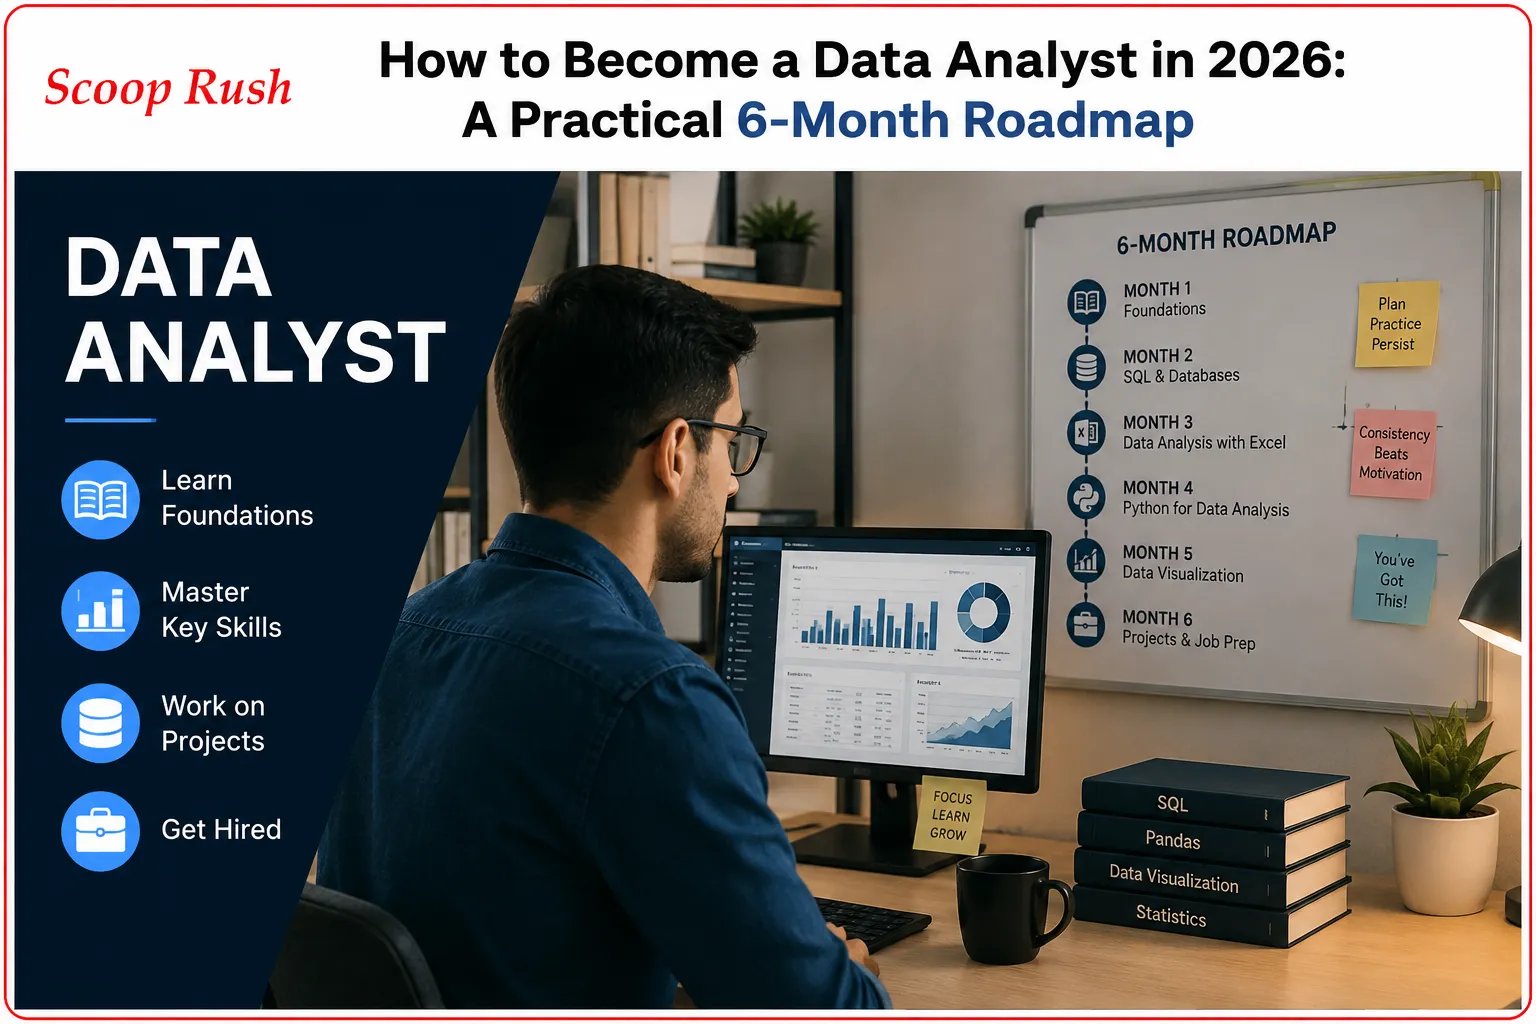
Thinking about becoming a data analyst in 2026 but not sure where to start? You’re not alone. Businesses now lean on data for almost every decision, and employers expect newcomers to be comfortable with spreadsheets, databases, dashboards, and increasingly, AI-assisted workflows. The good news is that you don’t need to learn all of it at once.
Search around and you’ll find dozens of learning guides, each pointing you toward a different starting line. One says Python first. Another insists on SQL. A third pushes dashboard tools before anything else. It’s no surprise beginners end up more confused than when they started.
A simpler approach works better: build one skill at a time, in an order that lets each new tool reinforce the last. This roadmap lays out six months of learning — Excel, then SQL, then data cleaning, then dashboards, then AI-assisted workflows — so that by the end, you have a portfolio of real skills instead of a stack of half-finished tutorials.
Month 1: Start With Excel, Not Advanced Software
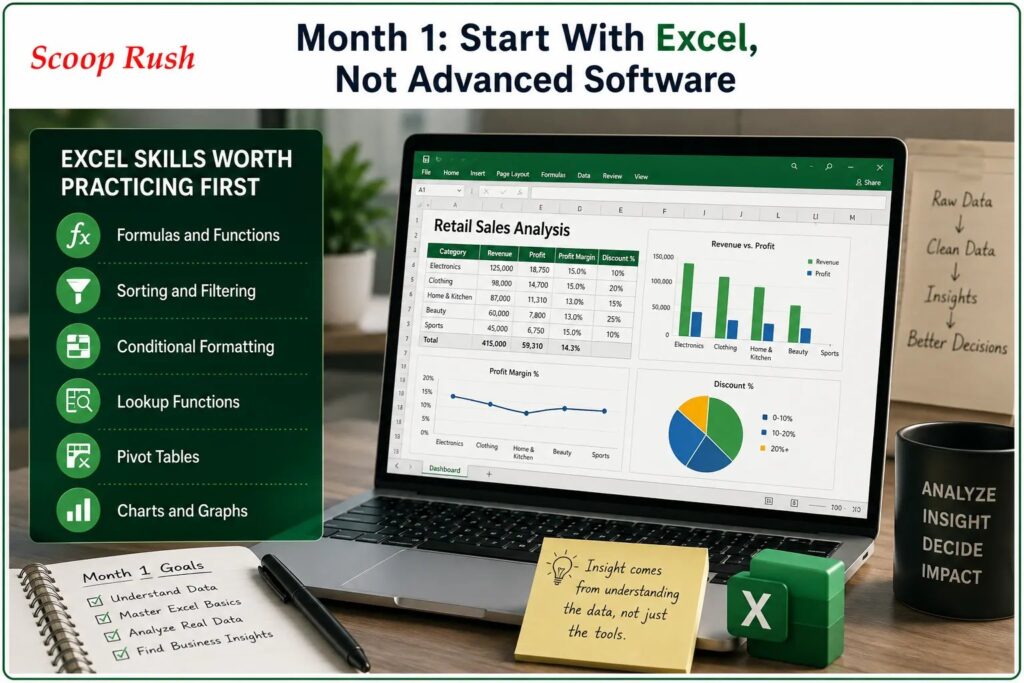
Every capable analyst starts by understanding data, not by memorizing software menus. Excel gets dismissed as basic, but it’s still one of the most widely used tools in business, and it’s the fastest way to build analytical instincts.
Excel Skills Worth Practicing First
During month one, spend regular time on:
- Formulas and functions
- Sorting and filtering
- Conditional formatting
- Lookup functions
- Pivot tables
- Charts and graphs
These aren’t just features to check off — they teach you how businesses actually look at information.
Picture a retail company where weekend sales are climbing but profits keep slipping. That’s a confusing signal on the surface. Break the numbers down by revenue, profit margin, product category, and discount level in Excel, though, and the story becomes clear: heavy weekend discounting is quietly eating the gains from higher sales volume.
Working with real, messy datasets — not sample files — is what builds this instinct. By the end of the month, you should feel confident organizing raw numbers, running calculations, and pulling a simple business insight out of a spreadsheet.
Month 2: Learn SQL to Query Real Databases
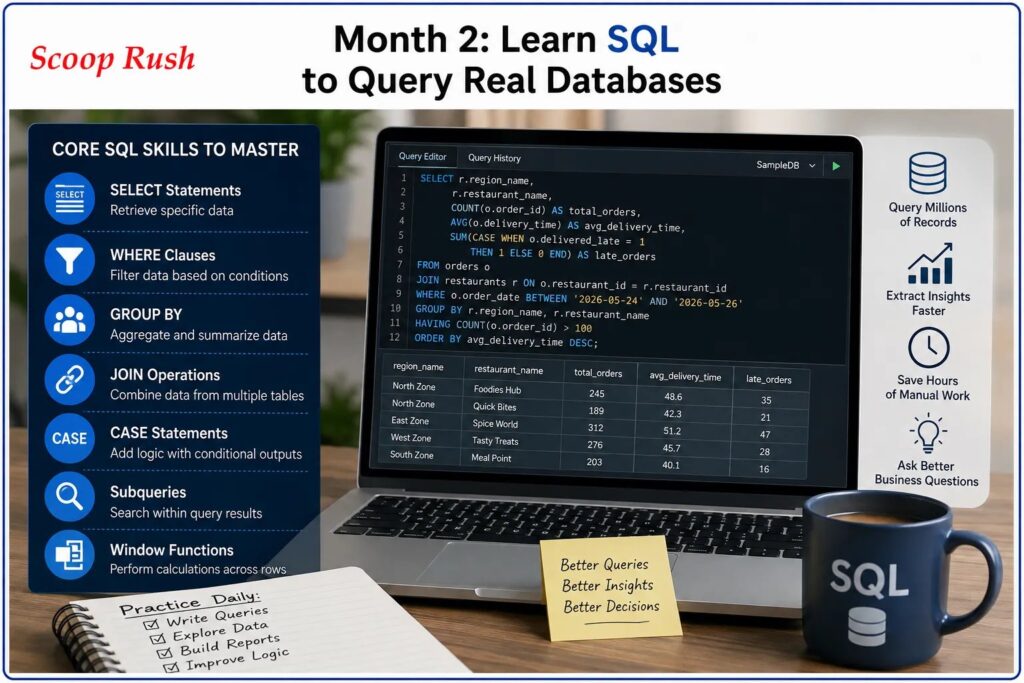
Once Excel feels natural, the next step for any data analyst in 2026 is SQL. If Excel helps you understand data you can see, SQL lets you pull data out of systems holding millions of records — which is where most business information actually lives.
Core SQL Skills to Master
Focus your second month on:
- SELECT statements
- WHERE clauses
- GROUP BY
- JOIN operations
- CASE statements
- Subqueries
- Window functions
Each of these answers a different kind of business question. Take a food delivery company seeing a spike in complaints over a holiday weekend. Nobody knows exactly why yet. With SQL, an analyst can pull delivery records, compare regions, check restaurant performance, and isolate the exact time windows where delays spiked — work that would take hours to do by hand.
SQL rewards daily practice more than most tools. Rebuilding reports and exploring how tables relate to each other trains you to ask sharper questions, which matters just as much as writing the query itself.
Month 3: Master Data Cleaning Before You Trust Any Report
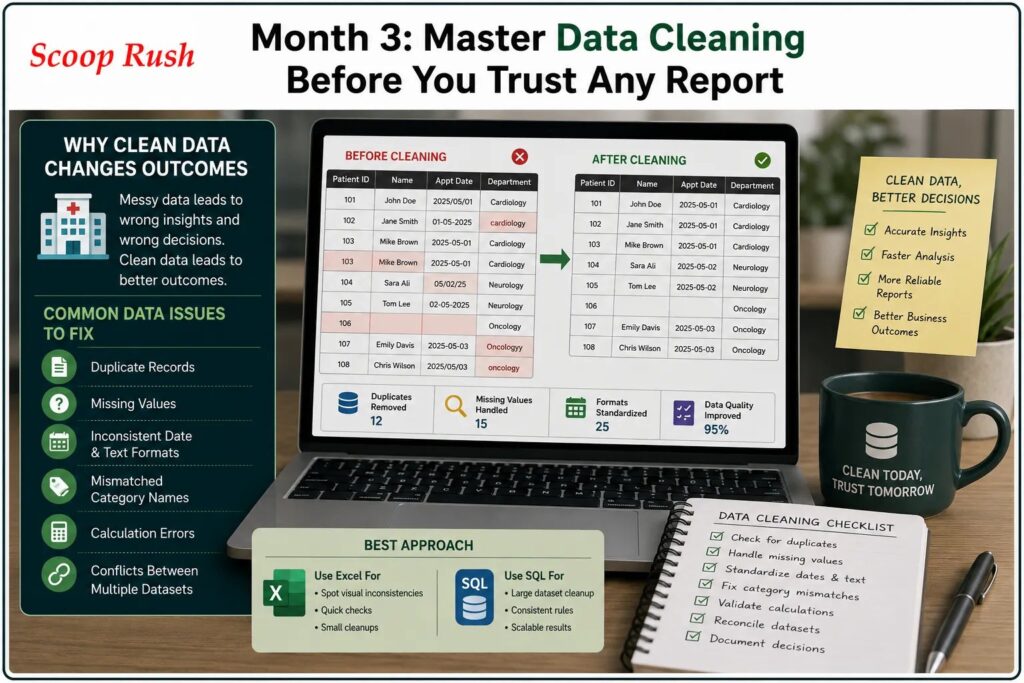
This is the stage beginners tend to skip, and it’s a mistake. Even a beautifully designed dashboard is worthless if the data feeding it is wrong.
Real-world datasets are messy by default — missing values, duplicate entries, inconsistent date formats, and typos are the norm, not the exception. Before any analysis begins, that mess needs to be sorted out.
Why Clean Data Changes Outcomes
Consider a hospital trying to cut patient wait times. If appointment records include duplicate entries, missing timestamps, or department names spelled three different ways by three different staff members, any conclusion drawn from that data is shaky at best — and shaky data can lead to decisions that affect patient care.
During month three, practice spotting and fixing:
- Duplicate records
- Missing values
- Inconsistent date and text formats
- Mismatched category names
- Calculation errors
- Conflicts between multiple datasets
Document each cleaning decision as you go — it’s a habit that saves you (and anyone reviewing your work) a lot of guesswork later. Combining Excel and SQL here works well: Excel is good for spotting visual inconsistencies, while SQL handles cleanup across much larger tables. By month’s end, you should be able to hand off a dataset that other people can actually rely on.
Month 4: Build Dashboards That Make Numbers Usable
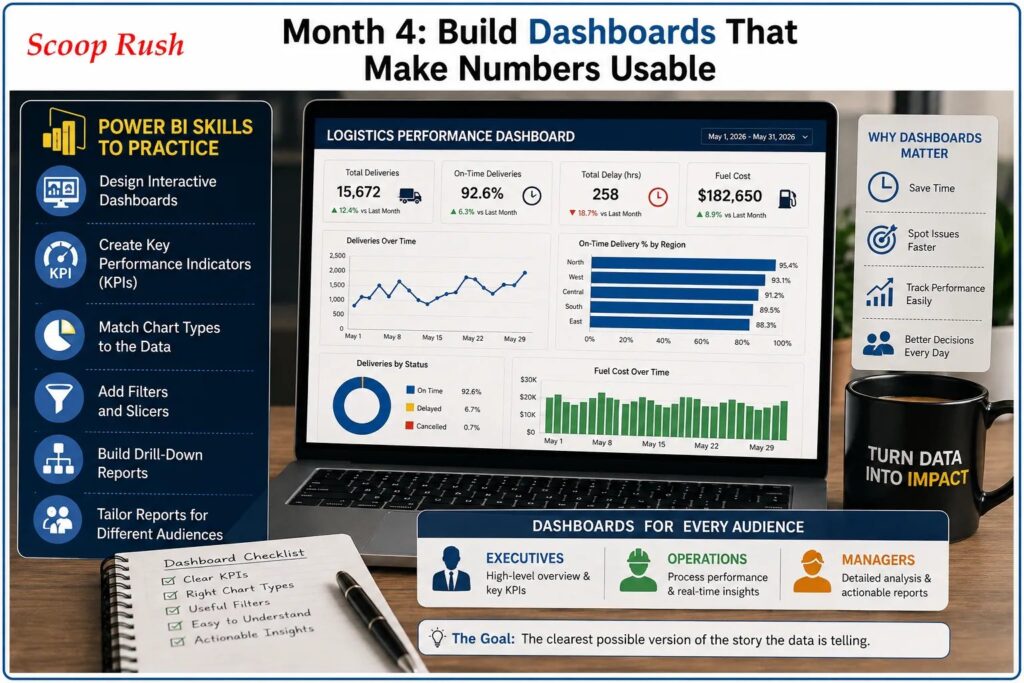
With clean data in hand, the next challenge is turning rows and columns into something a busy executive can understand in ten seconds. That’s the job of a dashboard.
Power BI Skills to Practice
Month four is about learning to:
- Design interactive dashboards
- Create Key Performance Indicators (KPIs)
- Match chart types to the data they’re showing
- Add filters and slicers
- Build drill-down reports
- Tailor reports for different audiences
Take a logistics company tracking deliveries across several regions. Managers want to know where delays are happening, which routes are performing well, and how fuel costs are affecting the bottom line. Buried in a spreadsheet, those answers could take hours to find. On a well-built dashboard, a line chart shows delivery trends over time, a bar chart compares regions side by side, and KPI cards flag whether targets are being hit — all at a glance.
Try building multiple dashboards from the same dataset: one for executives, one for operations, one for department managers. Each audience needs a different level of detail, and learning to adjust for that is a skill in itself. The goal was never more charts — it’s the clearest possible version of the story the data is telling.
Months 5–6: Use AI as a Tool, Not a Shortcut
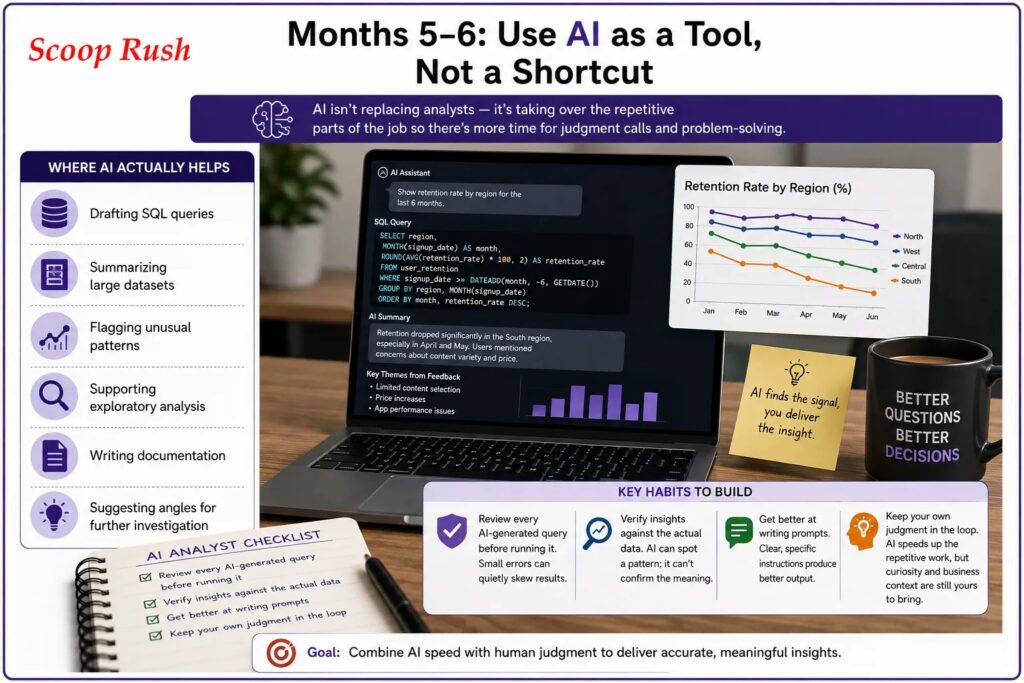
The final stretch of the roadmap reflects one of the biggest shifts in analytics work today. AI isn’t replacing analysts — it’s taking over the repetitive parts of the job so there’s more time for judgment calls and problem-solving.
Where AI Actually Helps
Modern AI tools are useful for:
- Drafting SQL queries
- Summarizing large datasets
- Flagging unusual patterns
- Supporting exploratory analysis
- Writing documentation
- Suggesting angles for further investigation
Imagine a streaming service trying to figure out why retention dropped in one region. Rather than reading through thousands of customer comments by hand, an analyst can use AI to summarize the feedback and surface recurring themes — then decide which of those threads is worth chasing with a proper SQL query.
That last part matters most. The analyst still checks every recommendation before it reaches a decision-maker. A few habits worth building during these two months:
Review every AI-generated query before running it. Small errors can quietly skew results.
Verify insights against the actual data. AI can spot a pattern; it can’t confirm the pattern means what you think it means.
Get better at writing prompts. Clear, specific instructions produce noticeably better output.
Keep your own judgment in the loop. AI speeds up the repetitive work, but curiosity and business context are still yours to bring.
Why a Structured Path Beats Random Tutorials
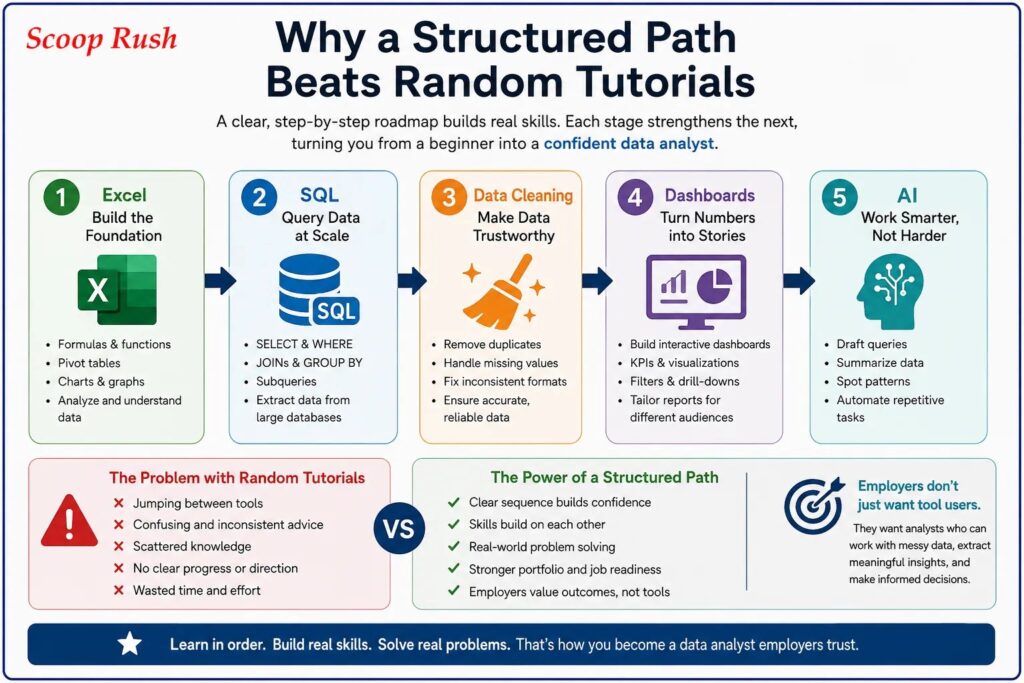
It’s easy to lose months jumping between YouTube tutorials, each one recommending a different tool as “the one to learn first.” That approach leaves most beginners with scattered knowledge and no real sense of progress.
A sequential path avoids that trap:
- Excel builds the analytical foundation
- SQL adds the ability to pull data at scale
- Data cleaning makes the results trustworthy
- Dashboards turn numbers into a story
- AI speeds up the routine work, while judgment stays with you
Each stage sets up the next, so the learning feels cumulative rather than scattered. And that’s ultimately what employers are hiring for — not a list of software names, but someone who can work with messy real-world data, communicate what it means, and back it up with sound reasoning.
Common Mistakes to Avoid Along the Way
Trying to learn everything at once. Excel, SQL, Power BI, Python, and AI tools all at the same time sounds efficient but usually just creates confusion. One skill at a time, built on the last, works better.
Skipping hands-on practice. Watching a tutorial isn’t the same as solving a problem with it. After each stage, build something small with a public dataset — it’s the fastest way to actually retain what you learned.
Treating data cleaning as optional. A dashboard is only as good as the data underneath it. Always check for duplicates, missing values, and formatting issues before drawing conclusions.
Over-relying on AI. It’s a productivity boost, not a replacement for thinking. Use it to draft and summarize, then verify everything before it goes anywhere near a decision-maker.
What Employers Actually Look For
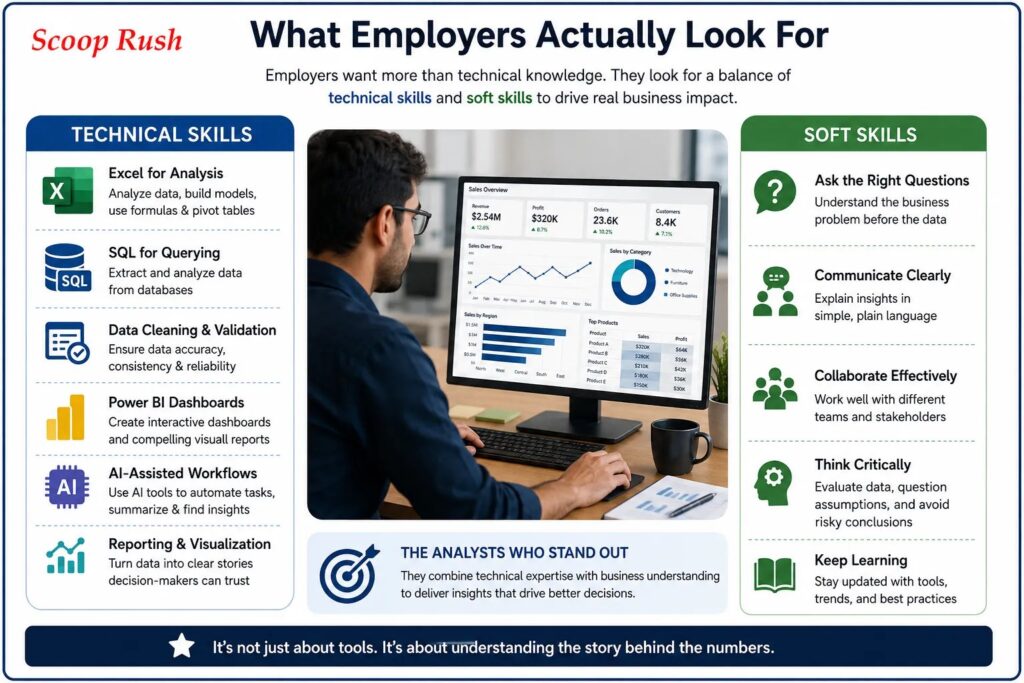
Technical skills open the door for a data analyst in 2026, but they’re rarely the whole picture. Employers evaluating data analysts in 2026 tend to look for a mix of both.
Technical skills: Excel for analysis, SQL for querying, data cleaning and validation, Power BI dashboard-building, AI-assisted workflows, and solid reporting and visualization habits.
Soft skills: the ability to ask the right business questions, explain findings in plain language, work well across teams, think critically before making a recommendation, and keep learning as tools evolve.
The analysts who stand out combine both — they’re not just comfortable with the software, they understand why the business cares about the answer.
Conclusion
If you’ve been wondering how to become a data analyst in 2026, the short answer is: stop trying to learn everything simultaneously, and instead follow a path that builds on itself. Start with Excel to develop analytical thinking. Move to SQL to pull data efficiently from real systems. Spend real time on data cleaning so your reports hold up to scrutiny. Learn to build dashboards that turn numbers into a story anyone can follow. And finally, bring AI into your workflow as a productivity tool — one you still double-check, not one you defer to.
Consistency matters more than speed here. A small project at the end of each month does more for your confidence and your portfolio than weeks of passive tutorial-watching.The core of the job for a data analyst in 2026 doesn’t really change from year to year: organize reliable data, ask good questions, explain what you found clearly, and help people make better decisions with it. Build that foundation over six months, and you’ll be in a solid position to start applying for entry-level analytics roles.
FAQs
What should I learn first to become a data analyst in 2026?
Start with Microsoft Excel. It teaches formulas, data organization, pivot tables, filtering, and charting — the fundamentals that make every later tool easier to pick up.
Should I learn Excel or SQL first?
Excel first. It gives you a visual, hands-on way to understand data before you move on to retrieving and filtering it from databases with SQL.
Is AI replacing data analysts in 2026?
No. AI takes on repetitive tasks like drafting SQL queries, summarizing data, and spotting patterns, but analysts still need to verify results and apply critical thinking before making recommendations.
Do I need advanced math to become a data analyst?
Not for most entry-level work. Percentages, averages, ratios, growth rates, and basic statistics cover the majority of day-to-day tasks. Advanced math becomes relevant mainly in specialized roles.
Can beginners realistically become data analysts in six months?
A structured six-month plan can get you the core foundational skills. Long-term success after that comes down to consistent practice, real projects, and continuing to build on what you’ve learned.

